
In today’s article, we’re discussing a few important KPIs in assessing a company’s efficiency. One of them is the return on sales (ROS). Moreover, we’re going to review a platform for marketing reports and analytics. It is called Whatagraph, and it will help you keep on top of your KPIs.
But first, what is a return on sales? It is the relationship between the operating profit and the net sales.
So, what are the net sales? The net sales represent the total revenue minus some things. These things are the applicable discounts, returns, or credits paid back to the customers. It is pretty much the same as revenue. Usually, companies from the retail industry would report net sales.
On the other hand, the operating profit is the net income after costs and expenses.
What returns on sales mean are efficiency and profitability. More precisely, it shows how a company produces and markets its services.

Return on sales is a financial efficiency ratio
So, it’s about time to ask the question of why return on sales is essential. Investors rely heavily on it. Creditors also check it. Stakeholders care a lot about ROS. Why? What does return on sales tell us? ROS is an indicator of profitability.
So, as an investor, profitability is a crucial factor. ROS is one of the efficiency ratios that provide clarity into that. It gives stakeholders valuable insight into a company’s potential. For example, “can that company offer dividends? “Let’s look at its ROS”.
Moreover, as an investor, you want to know the percentage of operating cash. The company you’re going to invest in has a certain revenue and operating cash. That cash flow is just as important as revenue. It shows the reinvestment potential.
The company’s ability to repay its debts is also reflected in its ROS. Based on ROS, you can make pretty accurate trend analyses. A business’s performance is reflected in its ROS. Moreover, ROS ratios also offer a good comparison point between companies.
Nevertheless, you should only compare companies from the same industry based on ROS. For example, a grocery retailer might have a lower return on sales ratio than an IT service company.
What about marketing? What is marketing return on sales? Well, in marketing, you don’t calculate ROS. You determine ROI.
Return on Investment (ROI) is another performance ratio. It is used to measure a company’s performance in relation to a specific investment. Marketers guide their campaigns by this performance marker. For example, ROI shows if a particular marketing campaign has returned good results.
To calculate ROI, you divide the current value of the investment by the cost of the investment.

Return on sales example
So, what is a return on sales ratio? We’ve already seen that.
The next question is, what is a good return on sales? Well, first of all, the higher the percentage, the more profitable your company is.
ROS is a highly effective metric in the long term. By comparing ROS from different years, you can see if your company is growing or not.
Let’s take the example of a company that has a $1,000,000 operating profit per year. The operating profit is $200,000. That means the return on sales is 20%. The company is using the other 80% to run the business. So, this ROS tells us the company should review its expenses. They need to find better ways of manufacturing products. They should also be more careful with their operations.
These ROS depend on the industry. So you should only compare them to other ROS within your industry. What is considered a good return on sales in retail might be bad in the tech industry.
Moreover, what affects return on sales? ROS does have its limitations. For one, ROS depends a lot on the business model. Different businesses have different operating margins. So, comparing them based on the return on sales can be confusing.
To do this, business analysts use a very complex metric. This metric takes into consideration financing, accounting, and tax policies. It also deals with interest rates, depreciation, etc. It is called EBITDA, but this is not the main point of interest in this article.
Return on sales vs profit margin
There are three types of profit margins. First of all, there’s the gross profit margin. Then there’s the operating profit and the net profit margin.
So, the gross profit is the total revenue minus the production costs. The manufacturing costs are both material and labor.
The operating profit margin is the total revenue minus the business expenses. This is also used to calculate the return on sales.
So, the business expenses range here is wider:
- Administrative expenses
- Depreciation
- Amortization
- Operative expenses
- Any other daily unpredicted business expense
The net profit is the final profit you get after all these expenses.
Example
You run a company that runs a total revenue of $10,000,000 per year. Nevertheless, you pay $8,000,000 for the manufacturing of goods. Another $500,000 goes in operating expenses. Moreover, you lose some $500,000 in interest payments. So, your net profit is $1,000,000.
Now, divide this figure by the total revenue, and you get 0.1. This is your net profit margin. Multiply it by 100. The 10% you get is your percentage profit margin.
So, the return on sales is the ratio between operating profit and net sales. The profit margin is the ratio between the total revenue and different production, operational or gross expenses.
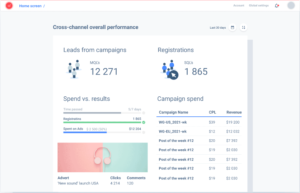
Whatagraph review: results tracking and reporting flow
So, we’ve been discussing return on sales and return on investment. Now, it’s time to discuss the tools for reporting. Whatagraph is one of the best platforms for this. It provides all the marketing analytics tools you’ll ever need.
Whatagraph supports businesses in simplifying their business reporting models. It is a much-needed tool for marketers and agencies alike.
Are you betting a lot of money on Social Media presence? Well, then you need a way to see that it works. Whatagraph is that solution?
What about your website content? How can you present your website analytics in a clear and straightforward infographic?
So, let’s see what it can do exactly, shall we?
Whatagraph key features
Whatagraph is an international analytics platform that allows companies to visualize their data in an infographic style. It basically makes everything easy to read and interpret.
Reporting with Whatagraph is just so much better. Whatagraph can collect data from multiple sources:
- Google Analytics
- Youtube Analytics
Nobody likes raw data, though. So, Whatagraph helps you create custom templates for it. Moreover, you can add your own branding to these templates, so they look really tailor-made.
If you’re a marketer running a marketing agency, Whatagraph is definitely the king of reporting. It automatically generates and sends your reports to your clients.
So, the main features of Whatagraph are:
- Data visualization and automation
- Various Integrations
- Data source centralisation
- Custom data reporting
Moreover, it can do pure statistics.
- Associations
- Statistical simulations
- Regression and multivariate analysis
- Forecasting
- Compliance tracking
- Statistical process control
- Survival analysis
Marketers also love Whatagraph because it can prove very useful for pure marketing activities.
- A/B testing
- Website and social media analytics
- Tracking campaigns performance
- Mapping the customer journey
- Tracking ROI
- Live dashboard
The dashboard and account management
Whatagraphs offers an intuitive dashboard that helps marketers in their work. It allows access to all your metrics in one place.
Consequently, you can use the dashboard to manage accounts. Moreover, you can manage custom reports. There is a lot of information made accessible through the dashboard. Your clients will love it.
Furthermore, you can manage all your accounts from one place. Integrate Whatagraph with Google Analytics. Link your Facebook page to Whatagraph. So, this way, you’ll have all your marketing data in one dashboard.
Whatagraph can send you a report on all of the linked accounts. You set your preferences.
Customizing reports
There is a custom reports tab in there. So, here, you receive a visual overview of your website. The key indicators are in there.
- Number of visitors
- Sessions
- Page views
- Traffic sources
Moreover, you can compare them against each other. You can customize the reports to reflect what you need. So, all these features come with a basic plan.
However, there is a pro plan. With this one, you can unlock even more reporting features. First of all, you can check your best-performing traffic channels. Secondly, you can see advanced bounce rate analytics.

Thirdly, Whatagraph offers page load times. These are essential for SEO, and domain authority.
So, you can do lots of things with Whatagraph custom reporting. As you can see, Whatagraph is a great reporting platform.
So, what about the white label?
Whitelabel is an extra feature you can get with the agency plan. So, you start with a white label. This means you can create a profile from scratch.
You can add your company logo to all of your reports. Moreover, you can also customize the color scheme. You can tailor the e-mails and the report’s appearance. So, you can do all of this to match your company’s profile.
Overall, Whatagraph is a very straightforward platform. You can edit your information at any time. The company details can change. Moreover, you can change or reset your passwords.
Why choose Whatagraph?
So, Whatagraph makes analytics clear and plain. Usually, people don’t like to work with data. It’s boring; it’s complicated. Nevertheless, Whatagraph changes all that and makes for efficient data visualization.
The tool gathers marketing data from multiple sources. It streamlines it so that you can visualize it properly. It is a true statistics powerhouse.
What is more, you can share reports with your customers. They can be in the loop with your marketing activities. No friction included.
The automated reporting feature is the cherry on top. You can basically set up automated reports. They will reach your clients in a specific time frame. You decide when and how.
For once, reporting becomes easy and efficient. So you and your clients can stay on top of your business results. That ROI and ROS are now in your hand. What do you do with them?

Pingback: Can Return on Sales Be Negative?
Great information!
Thanks!
I hope that the information on this blog will help a lot of people in online marketing.
Pingback: What is Comprehensive Income and How Do You Report It?